One of the more surprising developments in markets over the past six months has been the persistent decline in longer-term Treasury yields. This, coupled with the recent spike in short-term rates as the market has moved to price in rate hikes, has caused most measures of the yield curve to flatten dramatically. This can be seen in the chart below, where every rate inside of 10-years has risen since the end of the first quarter, but every rate 10-years or longer has declined.
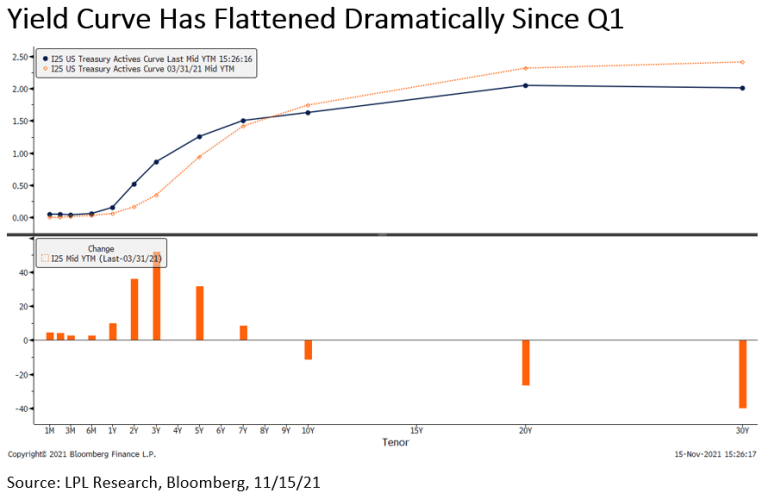
So why does this matter? Well the yield curve has been one of the most accurate predictors of past recessions, with the yield curve inverting ahead of every recession since World War II. And while we are still a long way from a full inversion, logically flattening would have to precede any inversion, leading to investor concern.
But the more important question is, will this continue to a full scale inversion? Maybe eventually, we don’t think that is on the near-term horizon when we take a closer look at the charts of the individual rates.
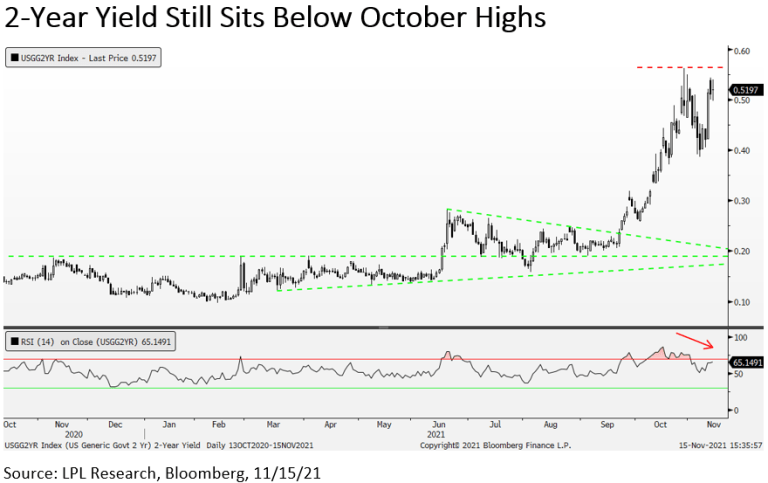
First up, the short end of the curve, where the two year-yield jumped more than 10 basis points last week following another hotter-than-anticipated inflation report. However, despite that move, the yield still sits below its late October highs and is showing signs of exhaustion with a bearish momentum divergence in the bottom panel. We always want to pay attention when price doesn’t confirm or follow the fundamental expectation, and the inability to push through to new highs following that report may be a sign that the market has already priced in enough rate hikes, and suggests 2-year yields may struggle to push higher in the near-term.
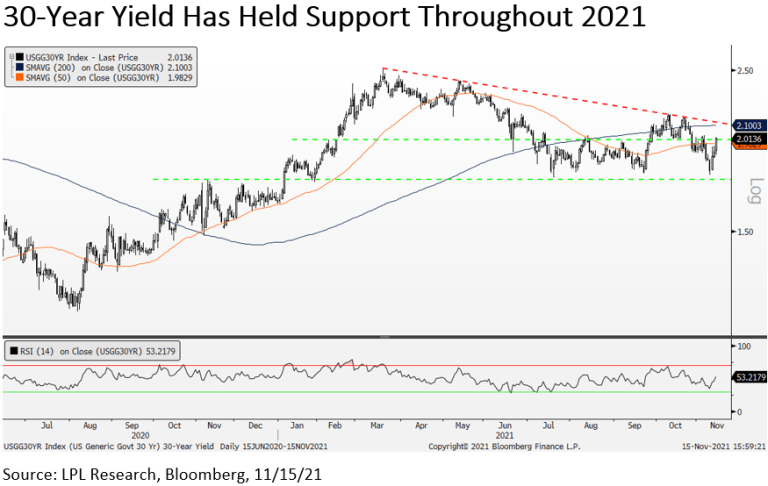
But what about the long-end of the curve? Has it stopped going down? We think it has when looking at the yield of the 30-year Treasury bond. After repeatedly holding support just below 1.8% so far in 2021, that interest rate has pushed back up above the key 2% level in recent days. It may be a high bar to expect the 30-year yield to eclipse its 2021 highs near 2.5% anytime soon, but a move up above 2.15% would signal a breakout and point to further steepening of the curve.
The charts above certainly make a technical case for some near-term steepening, but the fundamentals support this as well from where we stand. We believe Fed rate hike expectations have been pulled forward too aggressively, which not only has had the impact of raising short-term rates, but may be a reason for some of the decline in the longer end, as an overly aggressive rate hike campaign could hurt longer-term growth expectations and curb inflation. We expect the yield on the 10-year Treasury to end 2021 near its current levels between 1.5-1.75%, and then to rise modestly in 2022.
IMPORTANT DISCLOSURES
This material is for general information only and is not intended to provide specific advice or recommendations for any individual. There is no assurance that the views or strategies discussed are suitable for all investors or will yield positive outcomes. Investing involves risks including possible loss of principal. Any economic forecasts set forth may not develop as predicted and are subject to change. References to markets, asset classes, and sectors are generally regarding the corresponding market index. Indexes are unmanaged statistical composites and cannot be invested into directly. Index performance is not indicative of the performance of any investment and do not reflect fees, expenses, or sales charges. All performance referenced is historical and is no guarantee of future results. Any company names noted herein are for educational purposes only and not an indication of trading intent or a solicitation of their products or services. LPL Financial doesn’t provide research on individual equities. All information is believed to be from reliable sources; however, LPL Financial makes no representation as to its completeness or accuracy. All index and market data from FactSet and MarketWatch. This Research material was prepared by LPL Financial, LLC. Securities and advisory services offered through LPL Financial (LPL), a registered investment advisor and broker-dealer (member FINRA/SIPC). Insurance products are offered through LPL or its licensed affiliates. To the extent you are receiving investment advice from a separately registered independent investment advisor that is not an LPL affiliate, please note LPL makes no representation with respect to such entity.
- Not Insured by FDIC/NCUA or Any Other Government Agency
- Not Bank/Credit Union Guaranteed
- Not Bank/Credit Union Deposits or Obligations
- May Lose Value