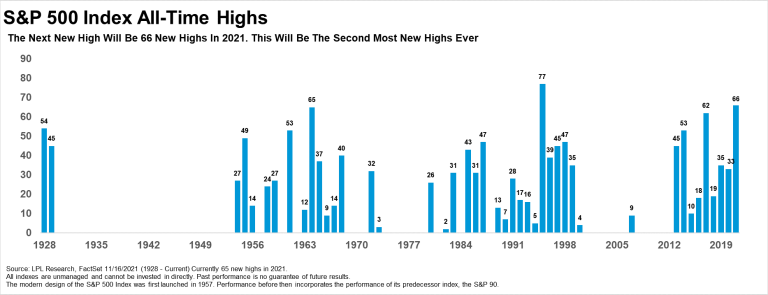
The incredible bull run of 2021 continues, with the S&P 500 Index only 0.02% away from the 66th all-time high this calendar year, tied with (for now) the 65 set in 1964 and behind only the record 77 set in 1995. “We’ve run out of superlatives to describe what we’ve seen so far this year, so we’ll keep it very simple. Years like this don’t happen very often, so let’s remember to enjoy it,” explained LPL Financial Chief Market Strategist Ryan Detrick.
As shown in the LPL Chart of the Day, 66 new highs this year would be second only to 1995. With about six weeks to go this year, 2021 is on pace to just barely miss setting a new record of new highs, but they say you won’t hit the pitches you don’t swing at and 2021 still has a lot of swings left, so anything is possible.
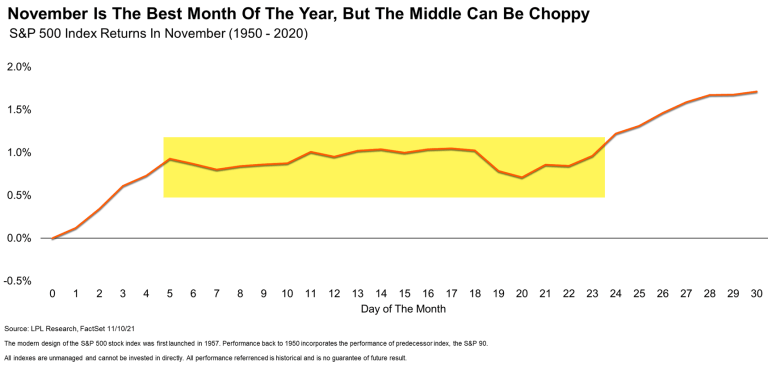
As we noted at the start of the month, November has been the best month of the year for stocks and it has been quite strong yet again this year. But be aware that November is historically rather strong early and late, while the middle can be choppy. Suggesting new highs could be a little tough to come by in the near-term, at least until we all get our fill of Turkey next week.
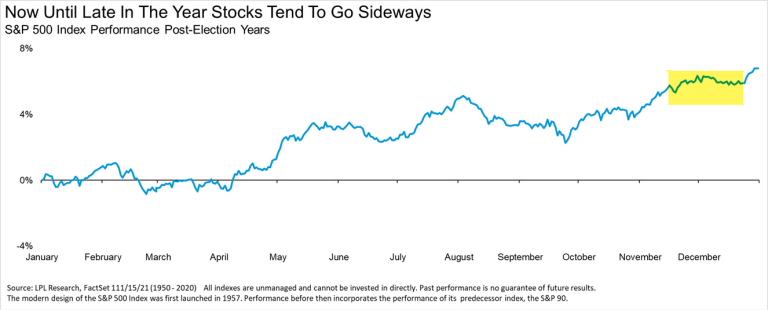
Additionally, post-election years can get quite choppy from now until late in December. After the run we’ve had lately, maybe some sideways chop is necessary, but we see further gains ahead through year-end.
IMPORTANT DISCLOSURES
This material is for general information only and is not intended to provide specific advice or recommendations for any individual. There is no assurance that the views or strategies discussed are suitable for all investors or will yield positive outcomes. Investing involves risks including possible loss of principal. Any economic forecasts set forth may not develop as predicted and are subject to change. References to markets, asset classes, and sectors are generally regarding e corresponding market index. Indexes are unmanaged statistical composites and cannot be invested into directly. Index performance is not indicative of the performance of any investment and do not reflect fees, expenses, or sales charges. All performance referenced is historical and is no guarantee of future results. Any company names noted herein are for educational purposes only and not an indication of trading intent or a solicitation of their products or services. LPL Financial doesn’t provide research on individual equities. All information is believed to be from reliable sources; however, LPL Financial makes no representation as to its completeness or accuracy. All index and market data from FactSet and MarketWatch. This Research material was prepared by LPL Financial, LLC. Securities and advisory services offered through LPL Financial (LPL), a registered investment advisor and broker-dealer (member FINRA/SIPC). Insurance products are offered through LPL or its licensed affiliates. To the extent you are receiving investment advice from a separately registered independent investment advisor that is not an LPL affiliate, please note LPL makes no representation with respect to such entity.
- Not Insured by FDIC/NCUA or Any Other Government Agency
- Not Bank/Credit Union Guaranteed
- Not Bank/Credit Union Deposits or Obligations
- May Lose Value
For Public Use – Tracking # 1-05213996